
Having lots of data in one place is great, and aggregated data is one of the major benefits of the Acquisio platform, but it’s equally important to be able to organize that data in a meaningful way, to better understand its significance.
To expand the ways you can group together data, Acquisio is introducing the categorizer option within the pivot table function.
The categorizer option allows you to group entities based on categories of your choosing and display the results in a pivot table. For example, you can now group together data with a similar Campaign Name or Ad Group Name. The best part is you define the match terms that will be grouped together, so you can see the information that matters to you, in a more digestible way.
To understand the significance of this addition, let’s look at the importance of the basic function –even before adding this new category option.
Importance of Pivot Tables
A pivot table is a program tool that essentially allows you to reorganize and summarize your data in an easy-to-read table that can be inserted into your reports.
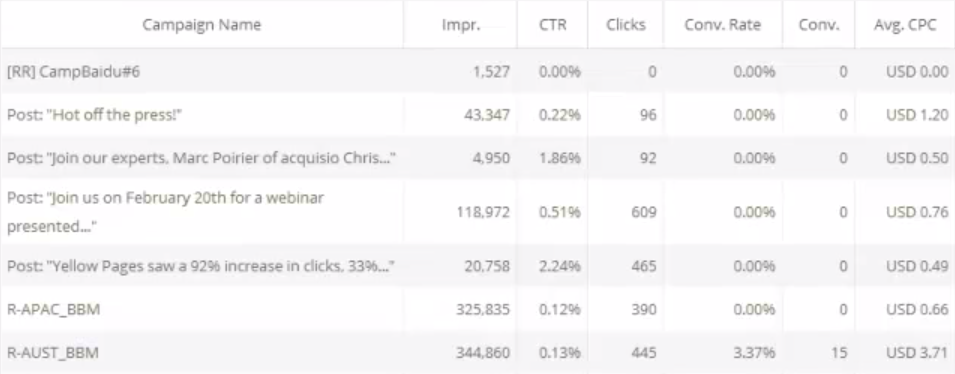
Why is this so important? When companies have massive amounts of information, it becomes difficult to manage and analyze this data. Data-driven decision making is more important than ever – with so much information available to marketers, pivot tables are a key tool for summarizing large amounts of data.
It’s as simple as that.
Acquisio has allowed marketers to create pivot tables within the platform for a while, yet now, the category option helps create a pivot table for all inclusive groups of data.
How to use the categorizer
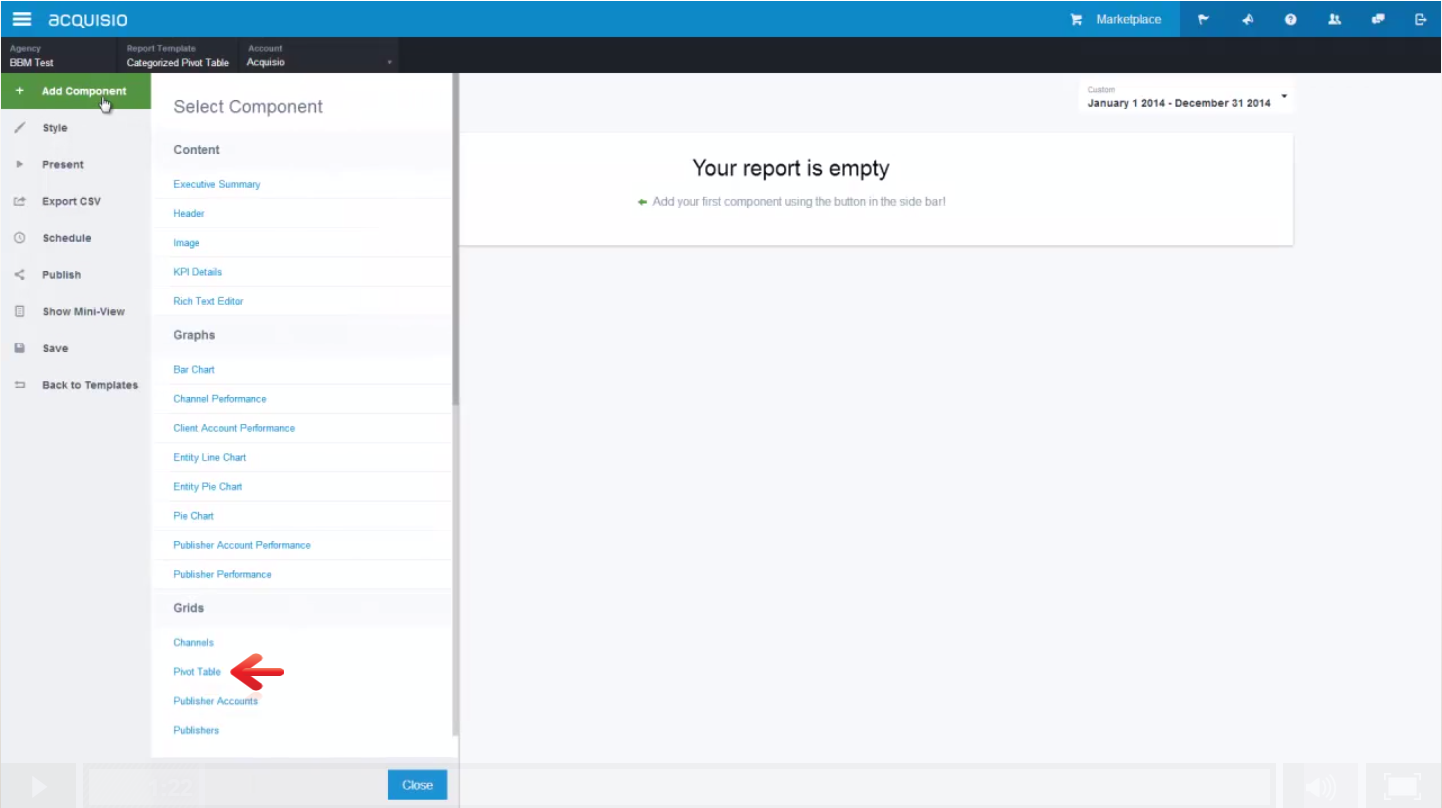
To use the categorizer, the first step is to create a pivot table by selecting “Add Component” and then scrolling down the “Select Component” list until you reach “Pivot Table” as seen in the screenshot below.
To create a pivot table in the Acquisio platform, you must fill out the required fields, including channel, date range and the metrics to be shown. Then, for the pivot table to appear, you must define how you want to group the data using the “Group By” option. Here is where you will choose the new option, “Category.”
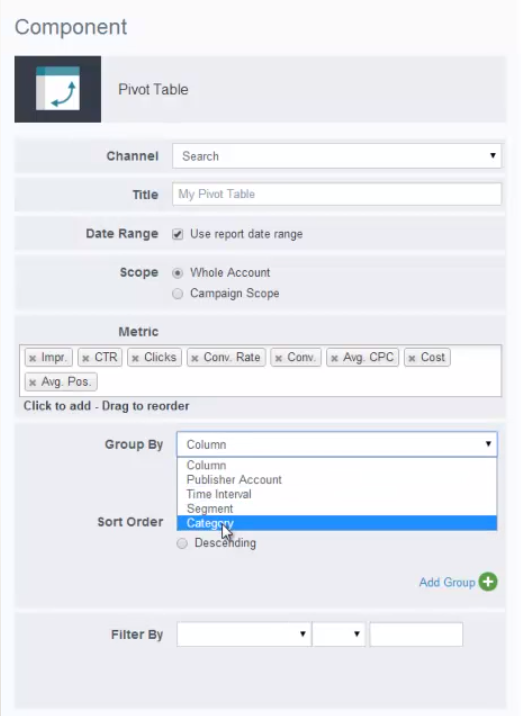
After choosing “Category,” new fields will pop up, asking you to specify the following, “Categorize Column,” “Use Categorizer” and “Categorizer Actions.”
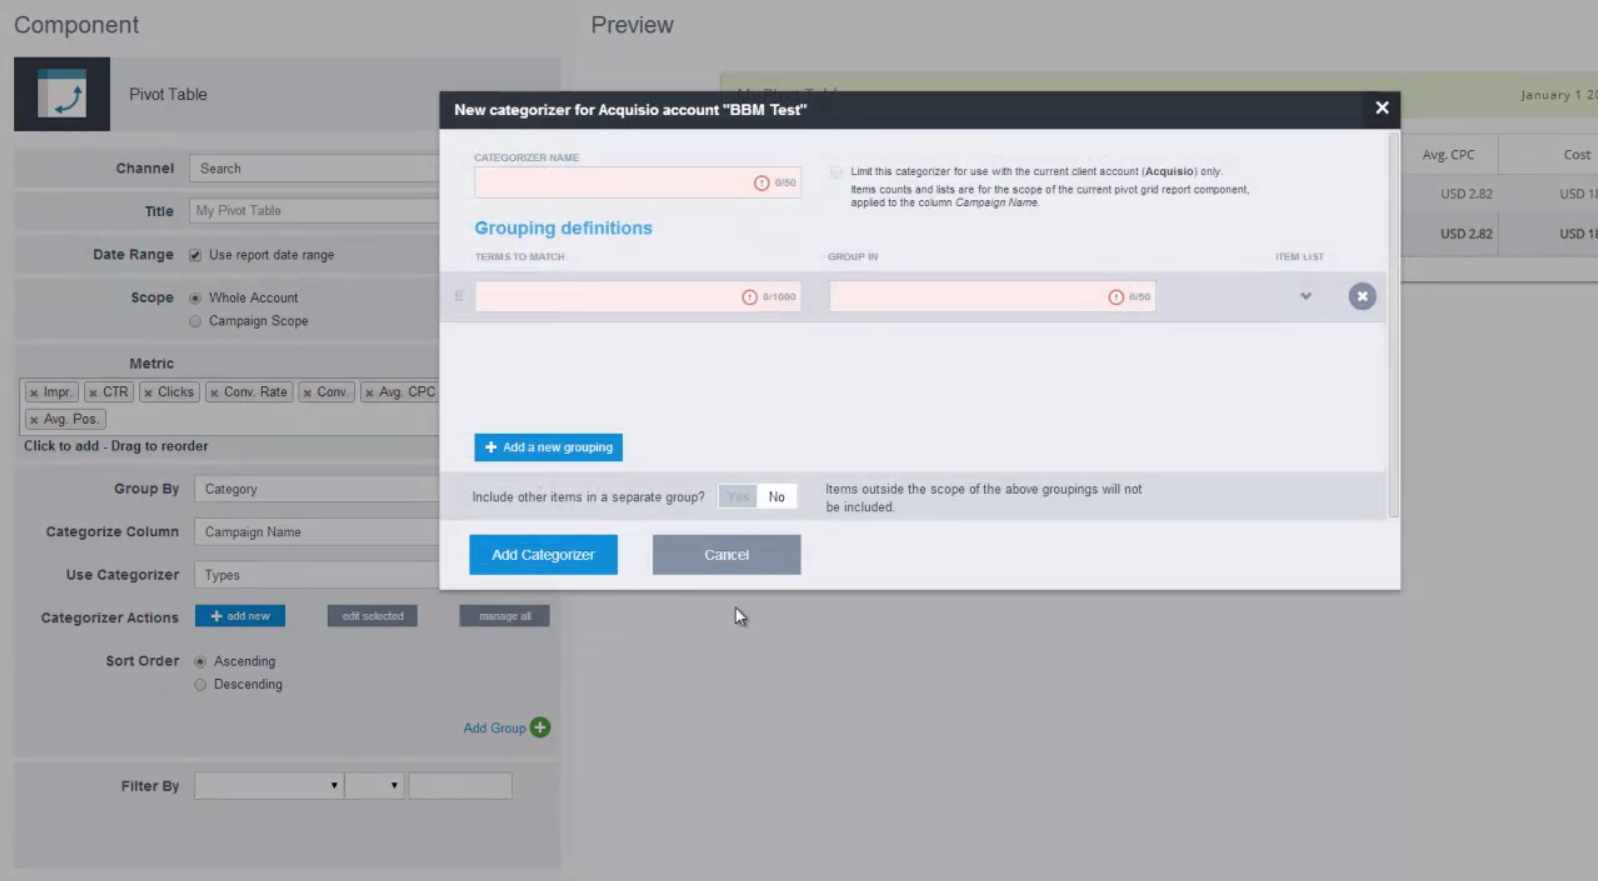
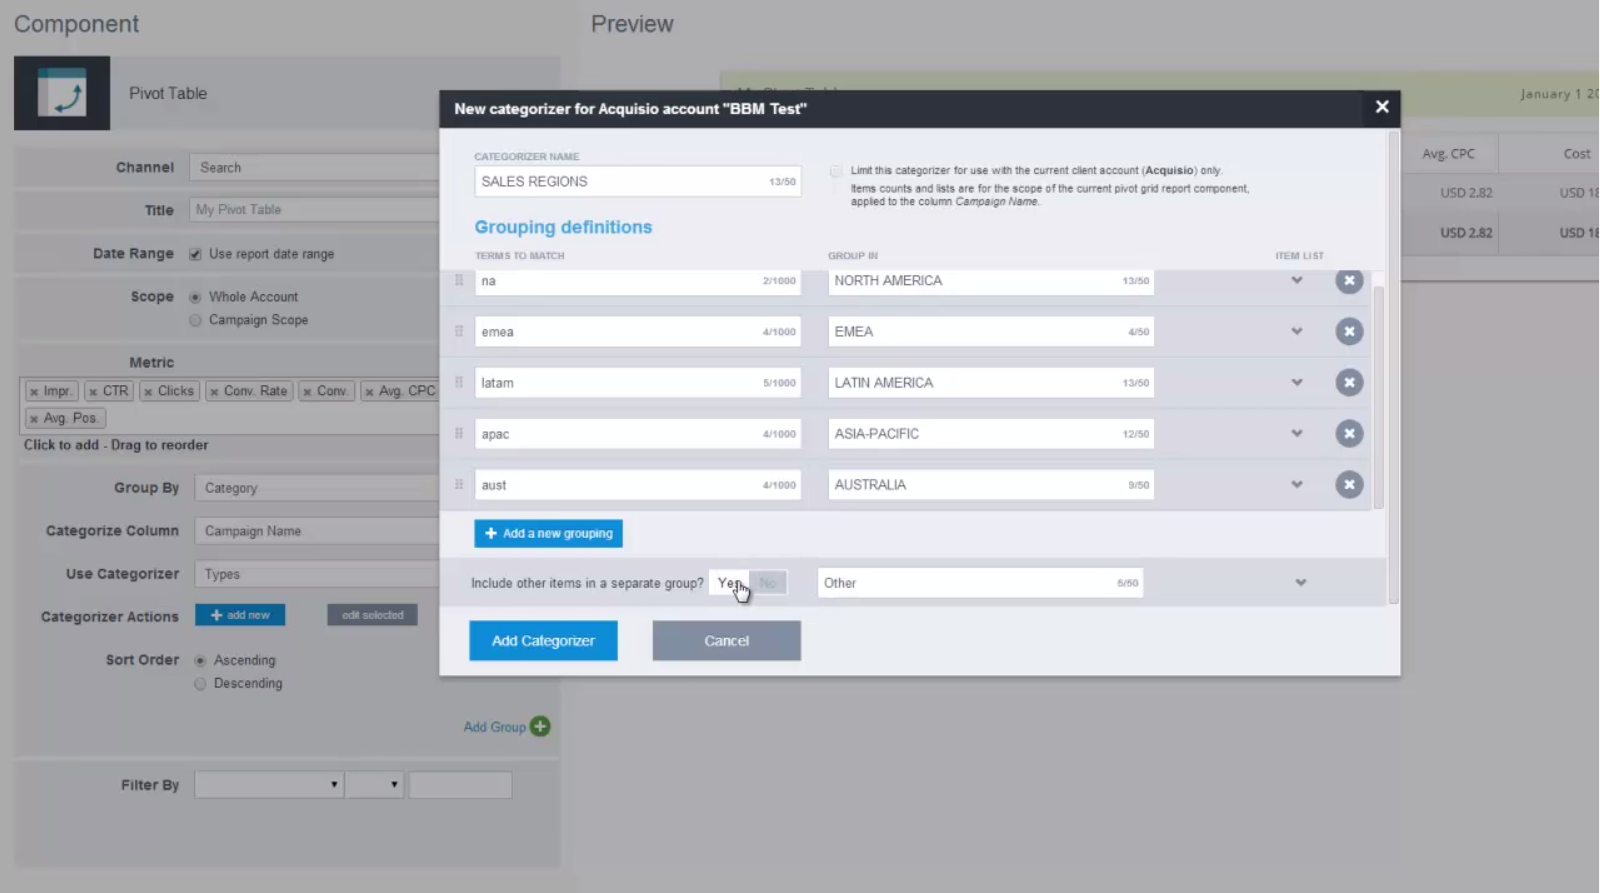
Once you give your categorizer a name, for example “Sales Regions,” if you want to categorize your data by geography, then you must choose the terms to match. These terms must be within the column names being searched to be pulled into the pivot table. So for example, if you label your campaigns and ad groups with NA to represent North America, your “terms to match” would be “NA” (not to be confused with N/A) and you would group this data in a “group in” category called North America.
Once you’ve decided the terms to match and given this grouping an appropriate title, you can view the items to be included in the list by clicking the “Item List” arrow on the right. If all the items you wish to include appear, finish up by pressing the blue “Add a new grouping” button.
You can continue to add as many groupings as you want, following the same process, until you have defined all of your groupings.
The last step before completing the categorizer is to choose whether or not to “include other items in a separate group,” that don’t correspond to any of the defined terms to match. If you choose “yes,” as shown above, a new “other” category will be created with the remaining data.
Finally, you can “Add Categorizer” and see your organized data in your pivot table.

More Tips
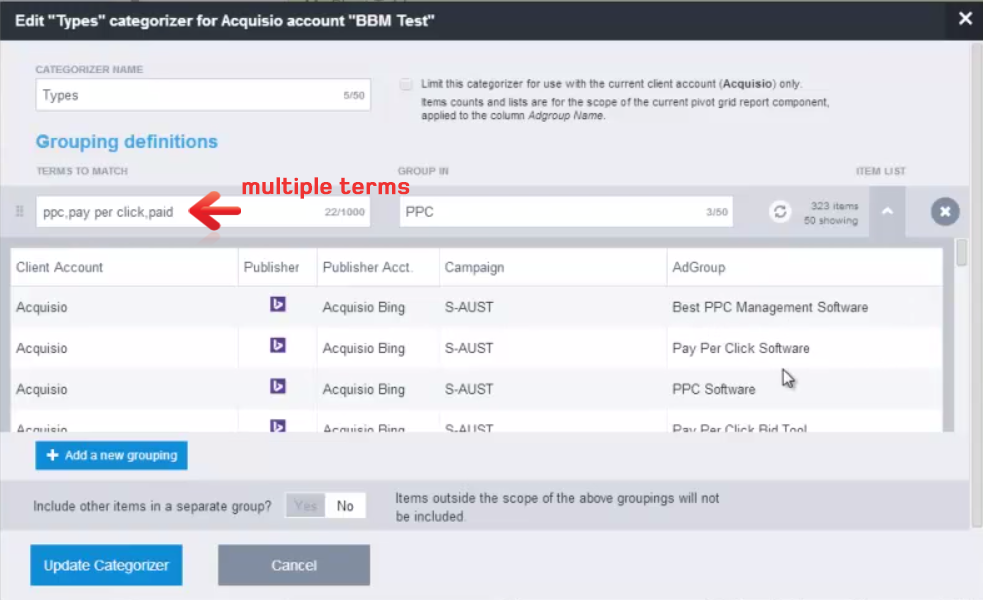
- You can select multiple terms within the “terms to match” option.
- If you have created a categorizer that could apply to data across your accounts, you can choose to save it, by leaving the “limit the categorizer” option blank. If the terms are generic enough that they can be used across your different accounts, you can reuse the categorizer in other accounts to save time. The categorizer name will appear in the dropdown menu under the “Use Categorizer” field.
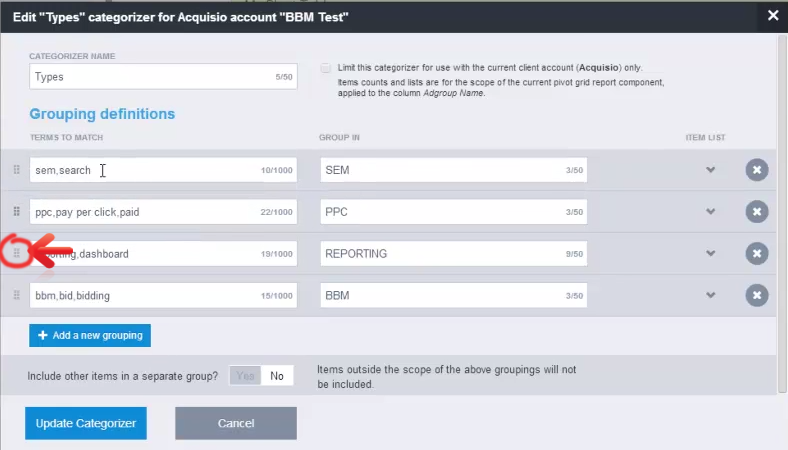
- If you have a “term to match” that could apply in multiple groupings, it will only be placed in one grouping. For example, if one of your groupings includes the word “paid” and another grouping includes the word “search,” anything with the term “paid search” will only appear in the grouping with the higher priority, meaning the grouping that is higher up on the list. You can order your different groupings by using the dotted rectangle on the left of each row.
And that’s it! After following these steps and these tips, you’ll have a great looking pivot table, which can be added to your reports.
For more info, or to clarify any questions concerning the above information, watch the video tutorial here.