In the PPC marketing world, it’s not “all about that base”, it’s all about that database. The value of data cannot be underestimated and you need to be able to read all of your data and give it meaning. With data from PPC, social media, analytics, call tracking, and several other sources, to benefit from all of this raw data it needs to be digestible so you can understand what the data is telling you.
We recently launched the categorizer feature in the pivot table so I thought it would be interesting to explore how the categorizer can help you organize and understand all of your PPC data. Here are some of the best ways to categorize your data.
Campaign or Ad Group Names
Likely the simplest but most powerful use of categorized pivot tables is grouping campaigns or ad groups. Naming convention is critical to effectively do this. Suppose you name your campaigns with this method: “Product | Location | Campaign Type.” You can then categorize or segment data by each of these entities for more precision.
To expand on this example, let’s say you sell bicycles and your campaign names include:
- Mountain Bicycles Canada Search
- Urban Bikes Canada Search
- Electric Bicycles US Search
- Cruiser Bikes US Display
- Cruiser Bikes US Search
- Mountain Bicycles US Search
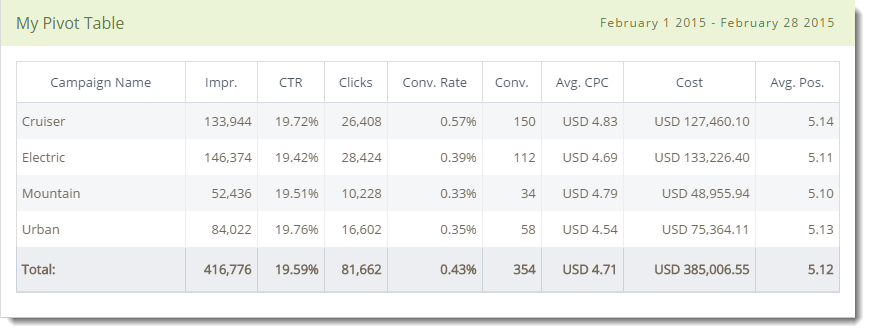
If your campaigns are named like this, you can group your campaigns by location to see your top locations, or campaign type to compare results from search versus display, etc. Alternatively, maybe you’re just curious about your products, no matter the targeted location nor the type of campaign.
You can then use the categorizer to group campaigns by product like this:
Quality Score
To stay on top of your keywords, you need to monitor and identify any big changes, especially in Quality Score. You can easily analyze Quality Score by creating a pivot table.
As you can see below, first I grouped the data by Quality Score, which summarized my chosen metrics by Quality Score. That may be interesting, but then to attach the Quality Score to a keyword, I added a second grouping of “Keyword Text” and now I can see the keywords associated with each Quality Score. If you want to further identify the ad groups and campaigns that the keywords belong to, you just need to add more groupings.
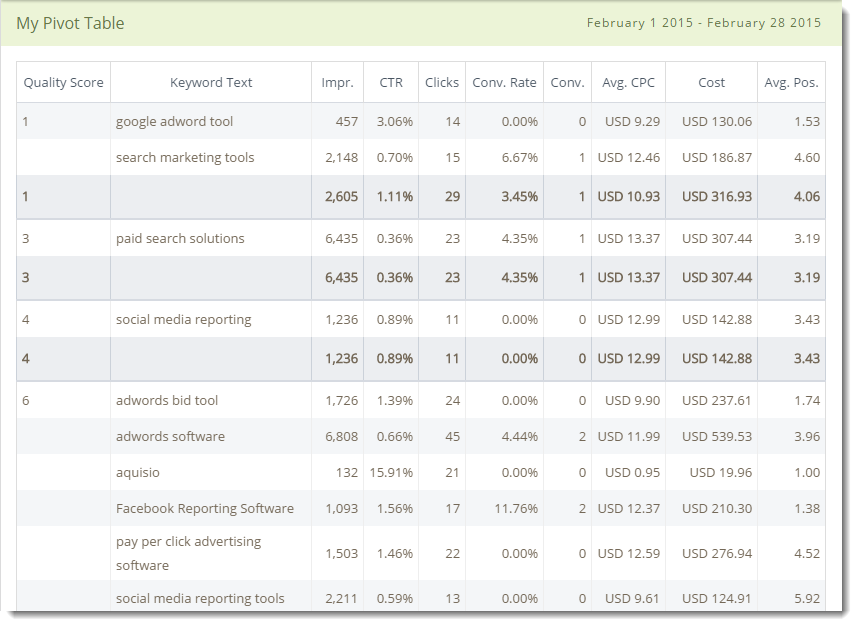
Once you have all the data organized this way, you can easily see which areas you need to work on to improve Quality Score.
Call to Action
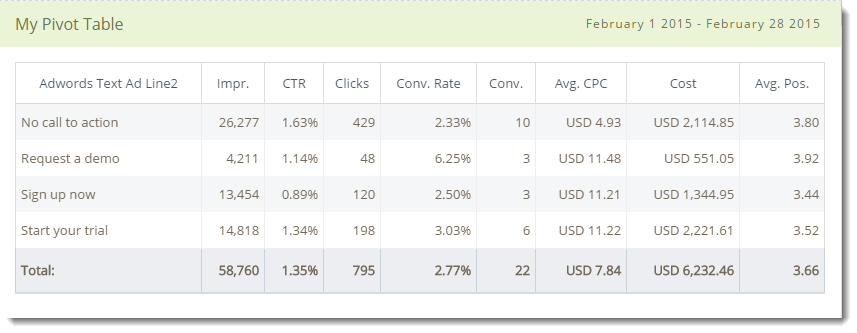
Another way of using the categorizer is for segmenting the ad copy. With the categorizer, you can basically examine each component of an ad: Headline, Description Line 1, Description Line 2, and Display URL.
With multiple ads running across multiple ad groups, you can consolidate your calls to action to see which perform best.
This video will show you how easy it is to implement these practices in a pivot table.
This is just a taste of the possibilities. Share with us how you’re using pivot tables and categorizers.